Drain Guard
A smart sewage monitoring system designed to tackle drainage challenges.
A smart sewage monitoring system designed to tackle drainage challenges.
Year
Year
Year
2025
2025
2025
Team
Team
Team
Fariya Hasan (that's me ;)
Nandini Inani
Deshna Deora
Fariya Hasan (that's me ;)
Nandini Inani
Deshna Deora
Fariya Hasan (that's me ;)
Nandini Inani
Deshna Deora
My Role:
My Role:
My Role:
UX Research,
UI/UX & Product Design
UX Research,
UI/UX & Product Design
Project Duration :
Project Duration :
Project Duration :
4 weeks
4 weeks
4 weeks
Sewage Cleaning
Sewage cleaning as been identified as SOUTH ASIA’S MOST DANGEROUS JOB. Research shows that more than 80% of sewage cleaning workers die before the age of 60 years. With new infrastructure comes new challenges air, noise, and especially water pollution. Despite modern urban growth, sewage systems remain outdated. They were designed decades ago, not for today’s population load. Overflow, leakage, and inefficiency continue to harm water bodies.
Sewage cleaning as been identified as SOUTH ASIA’S MOST DANGEROUS JOB. Research shows that more than 80% of sewage cleaning workers die before the age of 60 years. With new infrastructure comes new challenges air, noise, and especially water pollution. Despite modern urban growth, sewage systems remain outdated. They were designed decades ago, not for today’s population load. Overflow, leakage, and inefficiency continue to harm water bodies.
Current Gap


Problem Statement
Urban sewage systems lack preventive measures, leading to frequent overflows, unsafe manholes, and undetected hazards that put workers and residents at risk.
Urban sewage systems lack preventive measures, leading to frequent overflows, unsafe manholes, and undetected hazards that put workers and residents at risk.
How might we
HMW create a smart, connected system that predicts sewage issues, monitors hazardous conditions, and prevents accidents before they happen?
HMW create a smart, connected system that predicts sewage issues, monitors hazardous conditions, and prevents accidents before they happen?


BMC Dashboard
The BMC Dashboard centralizes real-time sewage data, helping authorities monitor water levels, toxic gases, lid status, and high-risk manholes for faster preventive action. We mapped the information architecture, built mid-fi wireframes, and refined them into hi-fi screens for clear monitoring and task management.
The BMC Dashboard centralizes real-time sewage data, helping authorities monitor water levels, toxic gases, lid status, and high-risk manholes for faster preventive action. We mapped the information architecture, built mid-fi wireframes, and refined them into hi-fi screens for clear monitoring and task management.


Supervisor App
For the Supervisor App, we first structured the information architecture to define key tasks and field workflows. We then developed mid-fi wireframes to map the experience, followed by hi-fi screens that enable supervisors to monitor alerts, view manhole conditions, assign workers, and track task progress on-site.
For the Supervisor App, we first structured the information architecture to define key tasks and field workflows. We then developed mid-fi wireframes to map the experience, followed by hi-fi screens that enable supervisors to monitor alerts, view manhole conditions, assign workers, and track task progress on-site.


Form Exploration
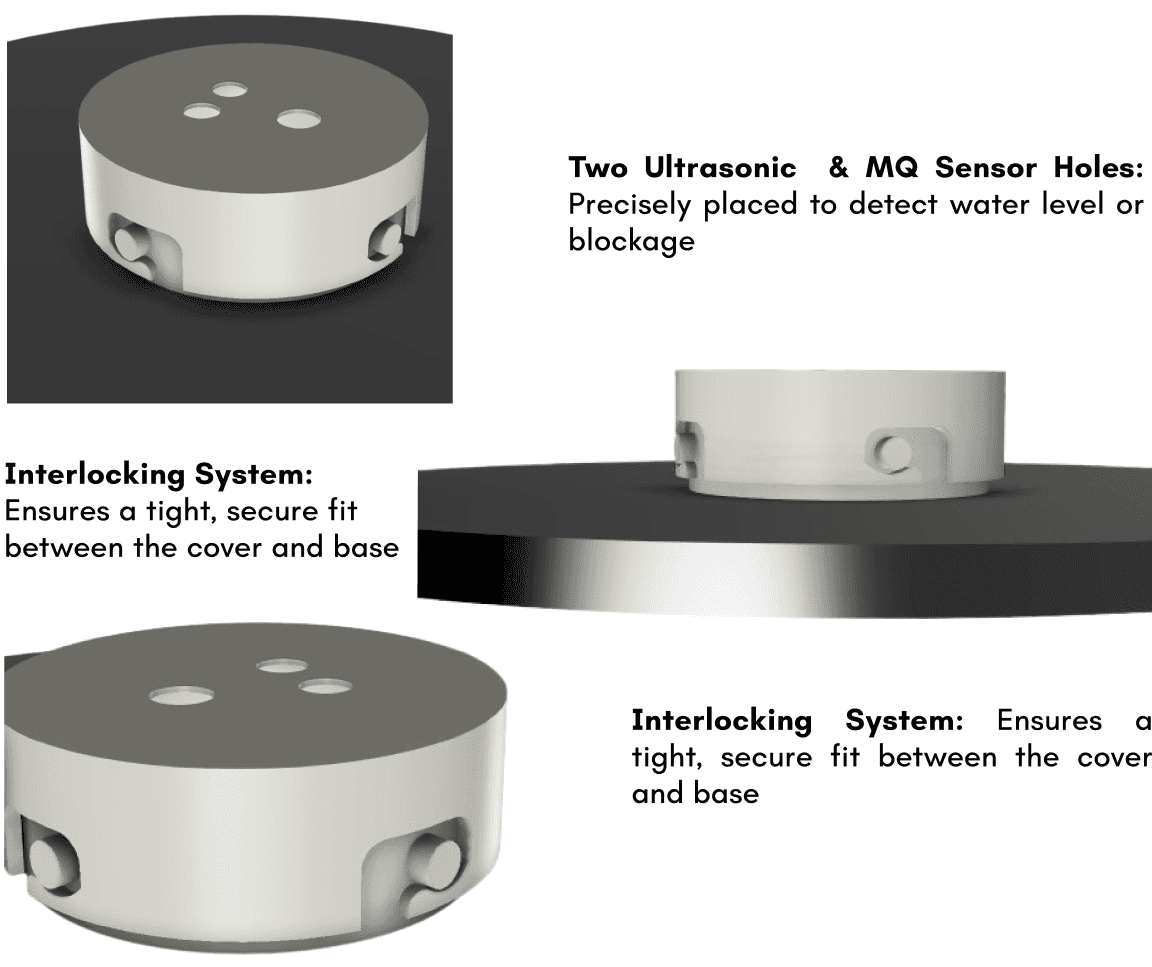
For the physical form, we explored multiple enclosure concepts and developed several 3D iterations to find a compact, durable form that could sit securely beneath the manhole cover. The final direction was designed to house and protect the sensor circuit, while keeping the components positioned to accurately detect water levels, gas conditions, and lid movement.
For the physical form, we explored multiple enclosure concepts and developed several 3D iterations to find a compact, durable form that could sit securely beneath the manhole cover. The final direction was designed to house and protect the sensor circuit, while keeping the components positioned to accurately detect water levels, gas conditions, and lid movement.

Final Model


Narrative storytelling

Results of Usability Testing
User testing was conducted across three stakeholder groups:
8 BMC Sewage Department officials tested the dashboard and found the map-based interface intuitive for identifying high-risk manholes and assigning issues to ward offices.
Officials also saw value in trend reports and pattern analysis for supporting preventive planning.
10 on-site deployment officials found the physical form and interlocking mechanism stable, safe, and suitable for sewage environments.
25 citizens found the MyBMC reporting flow familiar, intuitive, and easy to use.
User testing was conducted across three stakeholder groups:
8 BMC Sewage Department officials tested the dashboard and found the map-based interface intuitive for identifying high-risk manholes and assigning issues to ward offices.
Officials also saw value in trend reports and pattern analysis for supporting preventive planning.
10 on-site deployment officials found the physical form and interlocking mechanism stable, safe, and suitable for sewage environments.
25 citizens found the MyBMC reporting flow familiar, intuitive, and easy to use.

